Cuckoo sandbox is an automated malware analysis system. Its does utilize virtualization engine to isolate malware execution and analysis. You will be given a web-interface, as well as CLI tools to communicate with cuckoo, such to upload, and reviewing all reports.
Hope this would help anyone to have this. The tutorial is a bit technical. If you’re not familiar with Mac system or Terminal, you might want just to use any public sandbox.
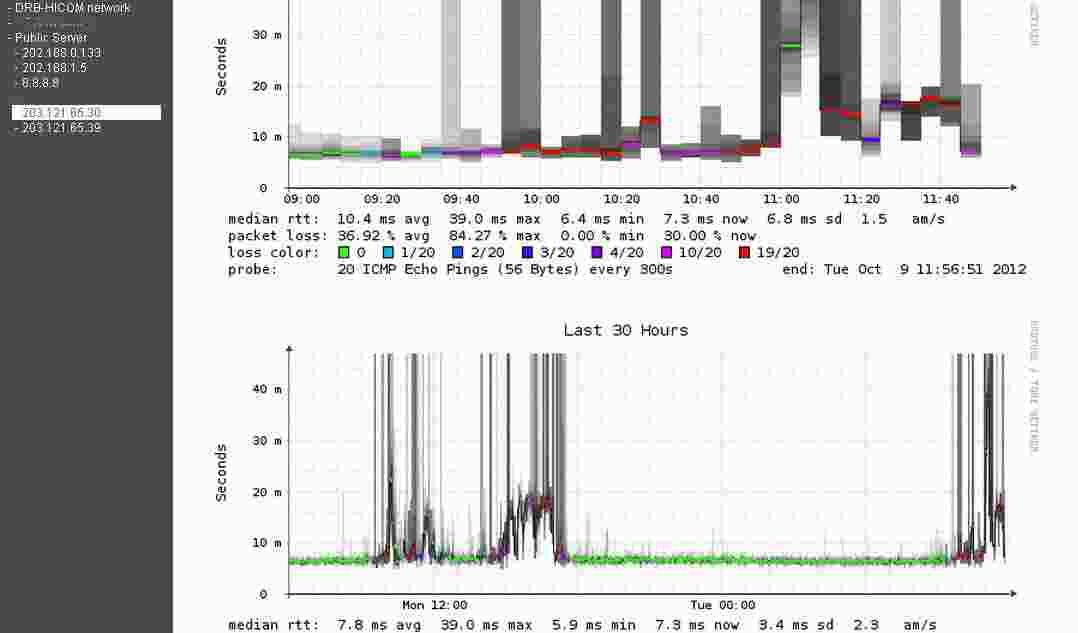
Smokeping is a great tool, written by Tobias Oetiker, which is the same guy who wrote MRTG, the world most popular graphing tool. Smokeping can gives you another dimension in viewing your network environment, that is ping latency, and graph nicely with nice colours.
Installation were easy, you can install it using apt-get in Debian-based distro. The configurations were done using the config file, which is usually located in /etc/smokeping/. The default configuration files includes some samples, which allow you to follow the syntax to add additional hosts to monitor.
The great thing about Smokeping, it tells you link quality metric, which usually being done manually with ping. The ping data will be graph as the sample graph here, which could tell you the ping latency (time it took for ping until response), and also dropped packet.
As the example above, we can see that during the day, the link quality dropped to almost 95% during the day, and latency increases as well. Even though you have a high speed link, this might tell a different story, which might caused by dropped packets at network devices during transit, probably it could not handle the huge traffic.
Last a few weeks, I had my website blocked by google safebrowsing API. The full-screen alert in red background, which scares my visitors away.
I quickly suspects my website have been compromised, followed by frequent attempts to exploit vulnerability and brute force attacks over the CMS used. The check goes from filesystem level for any backdoors, rough entry in database, rough entry of CMS options, but I could not find anything. Futher check at sitecheck.sucuri.com also does not reveal anything.
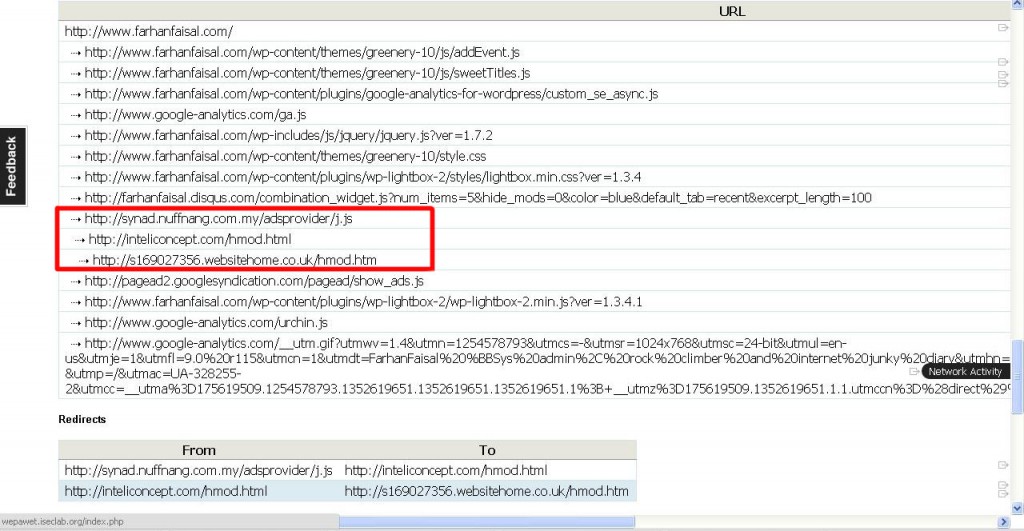
Later, wepawet revealed something. Wepawet scanned my page, and shows any redirection occurred on the page, and any remote reference to other sites, and Nuffnang ads appears redirecting my users to a malicious URL.
I’ve contacted Nuffnang regarding this, and they don’t want to accept this at first. As for immediate action, I’ve removed Nuffnang Ads from my page. I didn’t receive any earning from Nuffnang ads anyway, while I’ve made more than a few hundred dollars from this site through other advertising campaign.
Lately my server is receiving many request for wordpress brute-force attempts. Some of them do slow us down. The server resources were just wasted for the request. So, some searches got me to this site, which provide a good mod_security config to block this attack for a short period.
This is just a snippet, if you’re wondering. The hits can come at more than 20 request at one time. These are the code, mod_security configurations. I assume you already have mod_security running.
        # This has to be global, cannot exist within a directory or location clause . . .

        SecAction phase:1,nolog,pass,initcol:ip=%{REMOTE_ADDR},initcol:user=%{REMOTE_ADDR}


                # Setup brute force detection.

                # React if block flag has been set.

                SecRule user:bf_block "@gt 0" "deny,status:401,log,msg:'ip address blocked for 5 minutes, more than 15 login attempts in 3 minutes.'"

                # Setup Tracking.  On a successful login, a 302 redirect is performed, a 200 indicates login failed.

                SecRule RESPONSE_STATUS "^302" "phase:5,t:none,nolog,pass,setvar:ip.bf_counter=0"

                SecRule RESPONSE_STATUS "^200" "phase:5,chain,t:none,nolog,pass,setvar:ip.bf_counter=+1,deprecatevar:ip.bf_counter=1/180"

                SecRule ip:bf_counter "@gt 15" "t:none,setvar:user.bf_block=1,expirevar:user.bf_block=300,setvar:ip.bf_counter=0"
Nowadays I able to play around with flow data. Flow provide detail information on network traffic, for various purpose such as network monitoring, bandwidth monitor, traffic accounting archive and for security purpose.
We have configured a layer 2/3 switch to send sflow data to my monitoring server. Some visualization were done by nfsen, but, its quite limited. Its just a flow browser. Some other nfsen plugins might help, such as cndet and nfsight, which might give additional summary and analysis on your network traffic. Therefore, we have another flow analyzer, like OpManager Flow Analyzer, by ManageEngine.
For this, I still want the data to be kept in that machine, and send a duplicate of sflow data to OpManager. I’ve found samplicator, written by Simon Leinen at SWITCH. It works well, duplicating the data to another machine, and the tool able to keep the original source IP. As far as the OpManager view, the data came from the switch.
This error message appears today, and it seems related to fcgi.
As defined here, http://httpd.apache.org/mod_fcgid/mod/mod_fcgid.html#fcgidmaxrequestlen, the default value for MaxRequestLen is 131072, which is quite low for most implementation. I would prefer to use a higher value for this.
For cpanel users, the configurations lies in this file.
/usr/local/apache/conf/php.conf
You need to add an additional line for this, which set the limit to 2MB.
MaxRequestLen 2097152
The concept lies on logging slow performing application or scripts, to know which task are the most difficult to be completed on time. From there, you will know which task taking too much time and most probably resources, and need to be optimize to make sure it doesn’t affect the other tasks to be completed in timely manner
Mysql implemented slow log, which will log queries taking too much time to be completed. Mysql do have features where you can set global configuration on the fly, and will be in effect until the next mysql restart. If you want to make it permanent, it need to be placed in my.cnf configuration file.
To make enable slow log:
SET GLOBAL slow_query_log := 1;
SET GLOBAL long_query_time=10;
SET GLOBAL LOG_QUERIES_NOT_USING_INDEXES = ON;
SET GLOBAL slow_query_log_file = ‘path’;
slow_query_log (1 = enable, 0 = disable)
long_query_time (the treshhold to consider it is slow, in seconds)
LOG_QUERIES_NOT_USING_INDEXES (if turned ON, it will consider queries not using indexes as slow)
slow_query_log_file (the path to the log file)
If you want to make the settings permanent in my.cnf file:
log_slow_queries=”path”
long_query_time=10
log-queries-not-using-indexes =1
Besides mysql, your web server is a crucial part in processing your web-application as well, and for that, you might want to consider using this apache module, modlogslow, to log scripts which takes a long time to be completed.
It is an apache module, you need to compile it using apxs. Add some configurations to load the module file, and configure how will it behave, and you’re ready to go. The documentation provided in the archive, and also in the Google Code page, enough to get it running.
the code below will be enough to enable the module. Find httpd.conf, and put these few lines to enable it
LoadModule log_slow_module modules/mod_log_slow.so
LogSlowEnabled On
LogSlowLongRequestTime 8000
LogSlowFileName /usr/local/apache/logs/slow_log
Hope this would help you in monitoring your server, get to know who is sick and need attention.
As I go along managing a few sites, managing a few servers before, most of my time online were spent studying on socializing, information security, server administration (security, optimization), and others. ‘Others’ might contribute to a bigger portion, but just to emphasize that one part of server administration is optimization, to make a software work better in our case.
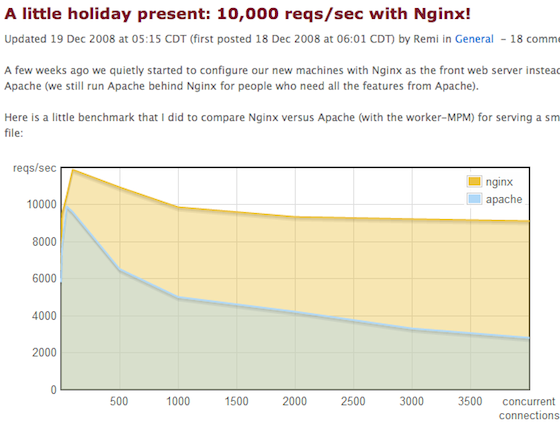
One major part of optimization is to use caching. One good example of caching is in reverse-proxy, which will sit infront of your server, and watching all requests passing through. Static contents will be cached in the first request, and the following request will be served from the cache. Previously, squid have been a good option for this. Afterwards, nginx comes into place, where it has proven itself to be a better candidate with small memory footprint, and capability to better handle static contents and a lot of request. Remi from WebFaction have done a benchmark where Nginx is serving static content at 10k requests per second. Cool!
Last few month I have read about varnish, and never had much more reading into it, until last few weeks where someone have come out with a case study on how varnish helps them in static content caching. I have done some tests on varnish, and it is not that easy to deploy one in your environment to best utilize it capability. It need to be tuned in accordance to your application, because you need to tell what to cache and what not to. On top of that, varnish is sensitive to cookies, you need to manage all the cookies as well. In an environment where you have unpredicted application deployment, such as hosting company, it would not be as affective as a dedicated configuration for a single application. Thats the compromise that you have to make. However, this is a good option to have, at least to reduce the requests that you’re getting on the server.
Content Delivery Network, or CDN do implement caching as well for all static contents that it is serving. The whole CDN idea is about caching as well, retrieving the same contents from the nearest node, and to reduce the loads from the main server. there are a few options of CDN nowadays. Cloudflare provide and easy interface to start using CDN. You just need to change your NS record of your domain, and you can start using much more features offered by Cloudflare such as DDOS protection and application firewall. Another option is MaxCDN, and Aflexi. Aflexi offers CDN software, for anyone to start offering CDN service to their clients. You can apply one from Exabytes, which do offer CDN harnessed by Aflexi.
Talking about application side caching, if you’re using wordpress, wordpress have some plugins which will do caching, such as wp-cache, wp-supercache. I personally prefer wp-cache, which works for me last time I tried it. One thing to note that, wp-cache will cache the whole page generated by wordpress, and will keep it for a pre-determined duration, in configuration section. Besides that, Jeff Star have written an article on how to make WordPress faster, basically by turning on some internal variables, which will skipped database queries for certain information by harcoding them in wp-config.php file.
For example, defining blog and site URL: define('WP_HOME', 'http://digwp.com'); // blog url
define('WP_SITEURL', 'http://digwp.com'); // site url
Hardcode stylesheet and template path
define(‘TEMPLATEPATH’, ‘/absolute/path/to/wp-content/themes/H5’);
define(‘STYLESHEETPATH’, ‘/absolute/path/to/wp-content/themes/H5’);
If you are a programmer, consider using memcache. Memcached is a lightweight in-memory object caching server, which can store object data from your application, to be retrieved again faster. It was developed by LiveJournal to harness their web operation until now. Detail of LiveJournal setup was entailed in this article, Distributed Caching with Memcached, by Brad Fitzpatrick. The article describe technically how memcached works, and how it is scalable, to be implemented site-wide. You will get the idea, on why the same web server can host memcached as well, possible more than 1 instance of memcached, and how your application will make use of the whole memcached cluster. In LiveJournal case, they have 28 instance of memcached running, holding 30GB of popular data.
One more thing, install this PHP script, to monitor your memcached cluster. Written by Harun Yayli, the script will be password protected, and enabled you to view information from each memcached instances configured. Hit rate, miss rate, uptime, version and data size.
This is necessary thing to do if you have access to many servers, and too many configurations to remember and typed, from the user, hostname and port number. You can make this short with ssh alias.
ssh alias allow you to connect your remote machine just by words.
# ssh mymachineor # scp file.txt mymachine:~/
Isn’t that awesome? You can configure all your host in a config file, located at ~/.ssh/config
And below are the sample configuration
Host mymachine

HostName [ip address or hostname]

User [username]

Port [port number]
You can just add alias for another host using the same syntax like above, in the same configuration file. If you’re connecting to default port, which is 22, you can just ignore the “Port” configuration line.