These tools really improves productivity
Fileloupe for Mac (link)

Path Finder (link)


Fotomagico (link)

These tools really improves productivity
Fileloupe for Mac (link)
Path Finder (link)
Fotomagico (link)
Weather rich data nowadays are available for rain, temperature and wind. We can visualize, we can playback the data, and got some awesome prediction out of them. I’ll try to list a few of the sites that I frequently visit, to get more insight on whats happening around the world (weather perspective). Some of them are coming in through API, which you can consume with.
The site focus on wind condition, typhoon or hurricane. It has some cool visualization of the wind, and the speed indicator as well. You can change the map projection,


Zoom.earth seems interesting, the map data are realistic, and all the earth feature are sharp. The satellite imagery comes from Himawari-8, owned by Japanese Meteorological Agency.
With zoom.earth you can play back the weather data, with day/night visualization, and the options to toggle data between rain, source of heat and wind.
One interesting feature is that, it has overlay of known or recognized typhoon. The spagetthi projection will be display, with the path and timing information.


Darksky is another cool map. It has wind precipitation, in a way, predictions. Also, “Feels Like Temperature”, Temperature, UV index, ozone and more.
As far as I’ve tested before, their prediction are one of the best, and most accurate. All the data are available through API. However, they seems to be acquired by Apple, and the API service will be continued until the end of 2022.


Rainviewer is very focus on rain data. If you need rain prediction, rain coverage, limited playback feature, this is suitable for your personal use. It is also available as an apps for Android and IOS.
The prediction on your phone is quite good. You will get notifications like, “expected to rain in the next xx minutes, and it will last for the next xx minutes.”
If you’re interested more into typhoon and hurricane data, head over to these sites.
Web loading performance is important for visitor retention, and SEO. User will likely leave your website if it takes too long to load. You need to benchmark your website, to understand each components that being loaded to the user to improve user experience, and didnt keep them waiting.
The first step is to do benchmarking on your website, in terms of load time, with details of each component, such as
There are many tools out there for benchmarking your site performance.
Google SiteSpeed is the most popular one, powered by Lighthouse, gives the detail analysis and suggestion for your website.
Its hierarchical map is quite different than any other service, where it give detail of each components loaded, in relation to the size. It can identify much of the those code are unused as well, if you’re looking into perfect reduction of code.
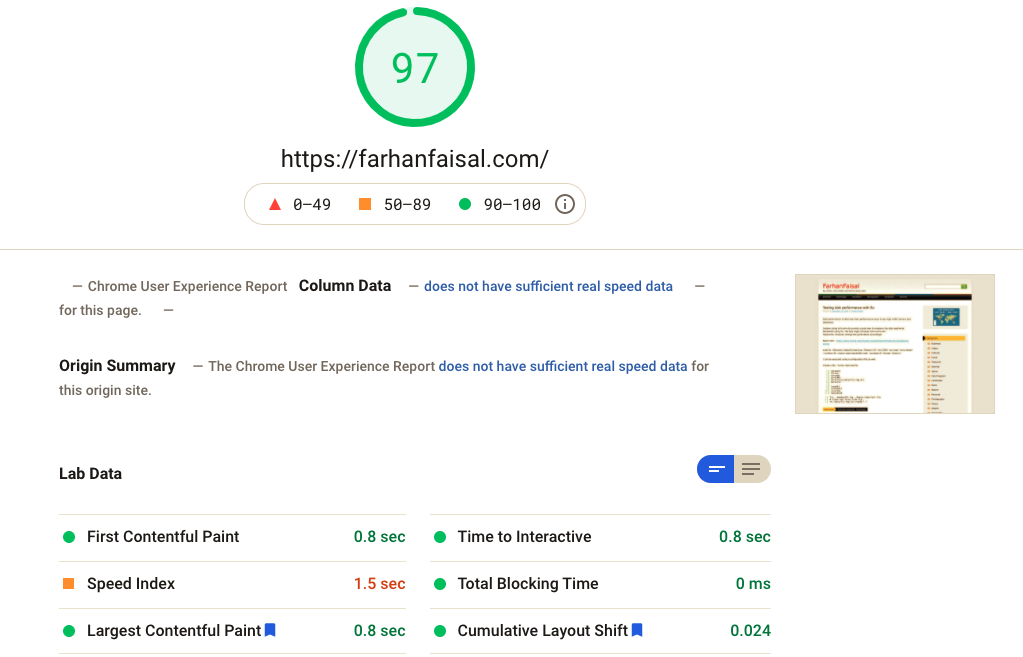
URL : https://developers.google.com/speed/pagespeed/insights/
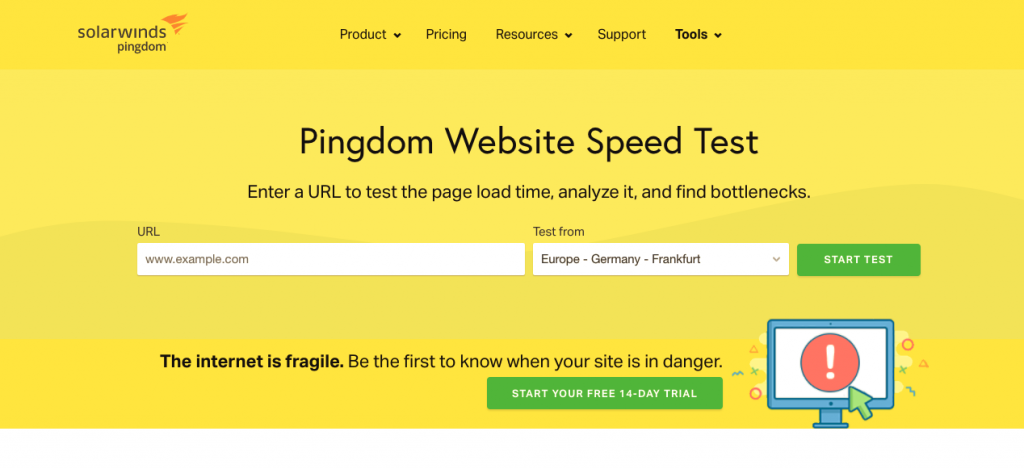
Pingdom have been in the operation for quite some time already. I can remember, when I was started developing websites, Pingdom is already there.
Pingdom have the options to choose the origin location of the test being made from. Its is important for you to understand if your CDN works, or how other region perceive your website in relation to your server location.
One other important feature in Pingdom is waterfall graph view, which visualize your web assets loading (images, css, js files) in comparison to each other in terms of timing. Its seems the feature is not available for free anymore.
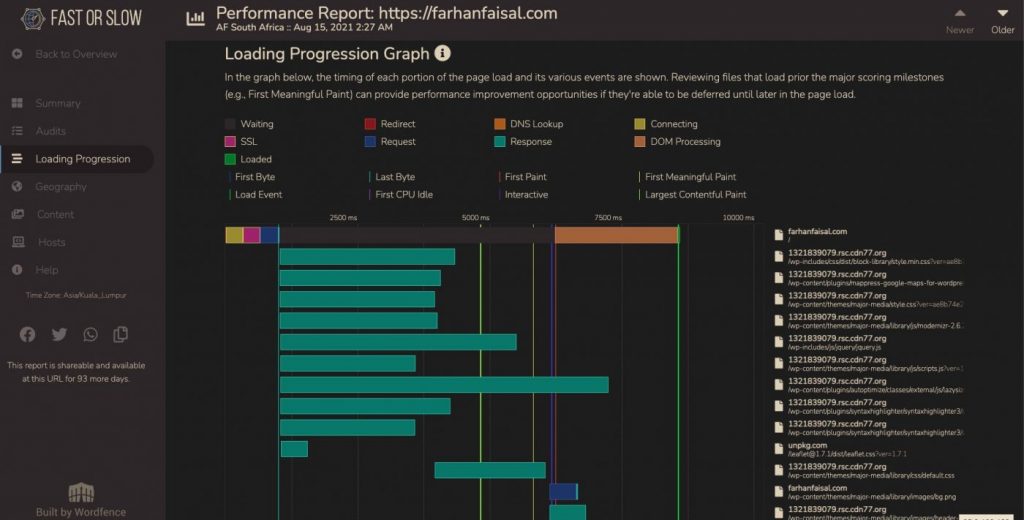
FastOrSlow is relatively new to the scene. Its free, and provided by Defiant, the company behind WordFence, the must have WordPress Security suite.
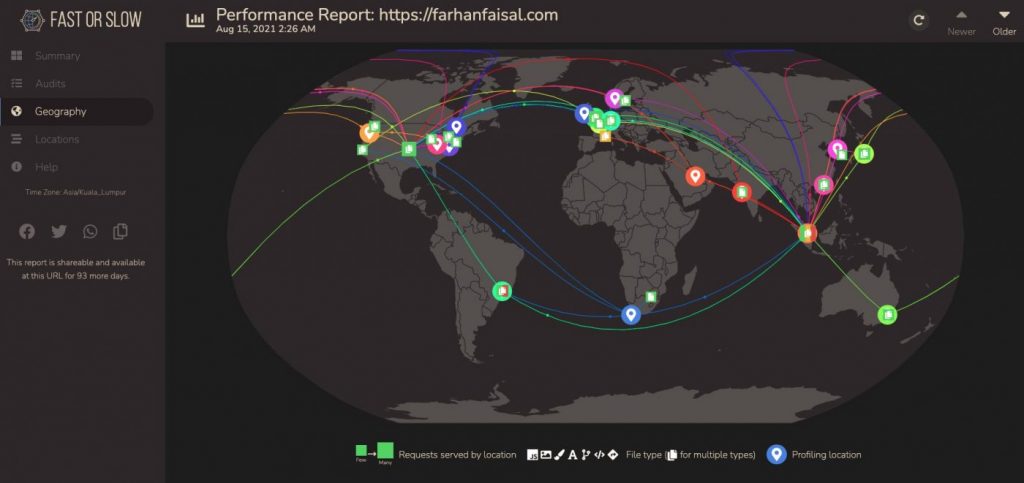
The coolest feature is that, you can perform the test from 18 locations globally all at once. And your score are given based on the data received from all location.
It gives a cool network map of data transfered to all locations from your server location/CDN, and also, the waterfall map. The waterfall map is one critical component you need, to understand your web performance on network level, and you can restrategize how the contents are loaded based on this data.
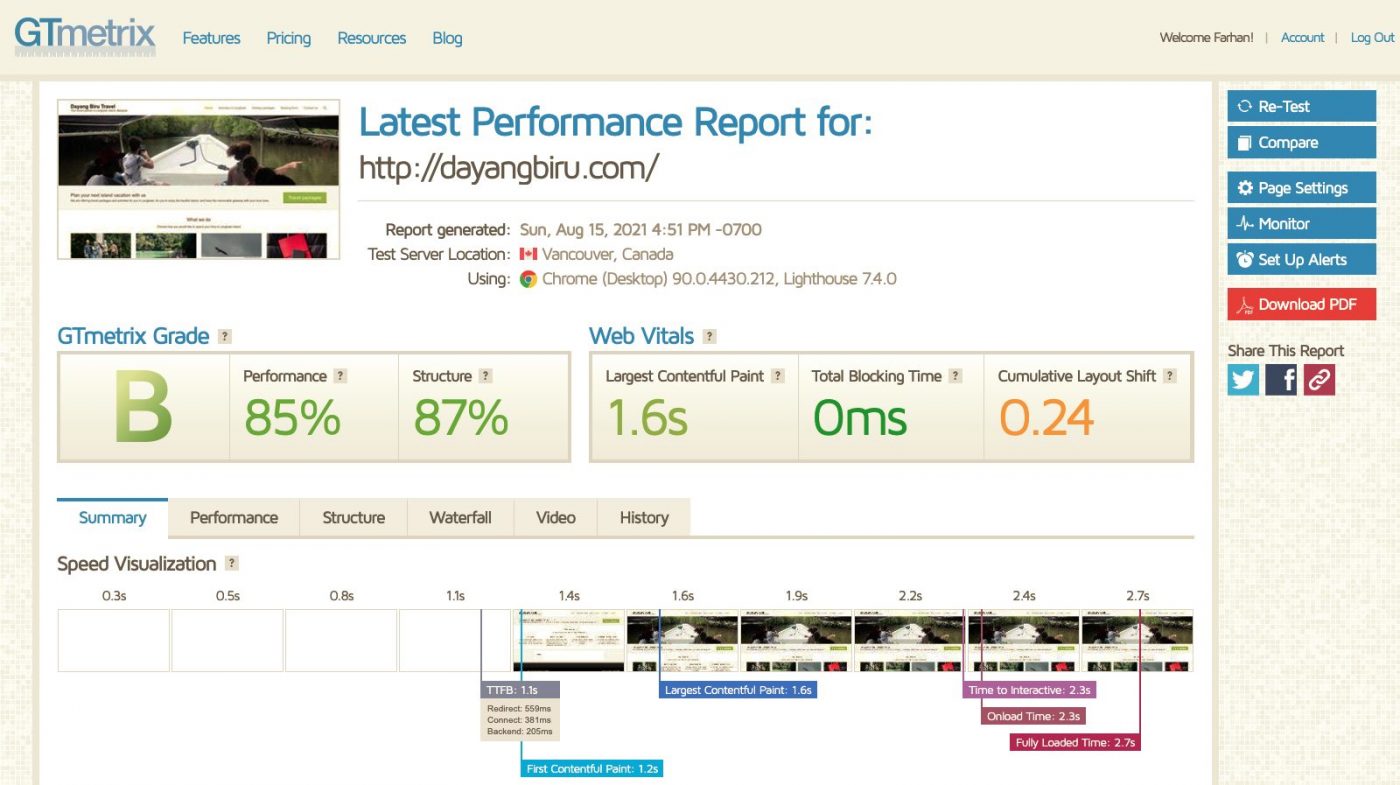
GTmetrix is one of the simplest yet powerfull benchmarking tool. It also comes in an API, which you can do some integration with your monitoring tool. The FREE version comes 10 API credit, and 1 daily monitoring slot.
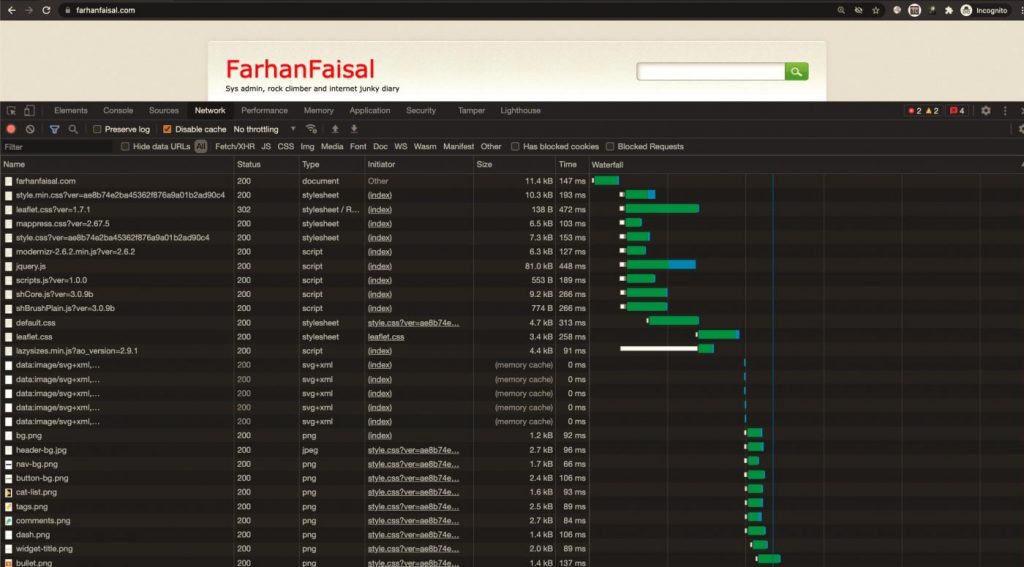
The last and the basic tool where everyone have, your own browser. in Chrome, right click on your page, and go to Inspect, or through window tab View -> Developer -> Developer Tool.
This is just the first step, in optimizing your web performance, by understanding your own web. From these info you’re getting from these services, you should be able to
Hopefully I could spend some time to look into each of these aspects later.
Disk performance is often the main performance issue in any high traffic servers and databases.
Instane sizing at humio do provide a good way to measure the disk read/write bandwidth using fio. The test might simulate how humio will
read/write. However, change the parameters accordingly.
Read more : https://docs.humio.com/cluster-management/infrastructure/instance-sizing/
sudo fio –filename=/data/fio-test.tmp –filesize=1Gi –bs=256K -rw=read –time_based –runtime=5s –name=read_bandwidth_test –numjobs=8 –thread –direct=1
I can be executed using a configuration file as well.
Create a file : humio-read-test.fio
[global]
thread
rw=read
bs=256Ki
directory=/data/fio-tmp-dir
direct=1

[read8]
stonewall
size=1Gi
numjobs=8
fio --bandwidth-log ./humio-read-test.fio
# Clean tmp files from fio:
rm /data/fio-tmp-dir/read8.?.?
# docker pull elasticsearch:6.8.5
 SCRIPT=`realpath $0`
 BASE=`dirname $SCRIPT`

         mkdir -p $BASE/esdata1
         docker run -p 9200:9200 --name elasticsearch -v $BASE/esdata1:/usr/share/elasticsearch/data \
         -e "http.host=0.0.0.0" \
         -e "cluster.name=elasticlogging" \
         -e "node.name=esnode1" \
         -e "node.master=true" \
         -e "node.data=true" \
         -e "http.cors.allow-origin=*" \
         -e "ES_JAVA_OPTS=-Xms256m -Xmx256m" \
         -e "discovery.zen.minimum_master_nodes=1" \
         -d elasticsearch:6.8.5


         mkdir -p $BASE/esdata2
         docker run --name elasticsearch2 -v $BASE/esdata2:/usr/share/elasticsearch/data --link elasticsearch \
         -e "http.host=0.0.0.0" \
         -e "cluster.name=elasticlogging" \
         -e "node.name=esnode2" \
         -e "http.cors.allow-origin=*" \
         -e "ES_JAVA_OPTS=-Xms256m -Xmx256m" \
         -e "discovery.zen.ping.unicast.hosts=elasticsearch" \
         -d elasticsearch:6.8.5
sudo apt update
 sudo apt -y install apt-transport-https ca-certificates curl software-properties-common
 curl -fsSL https://download.docker.com/linux/ubuntu/gpg | sudo apt-key add -
 sudo add-apt-repository "deb [arch=amd64] https://download.docker.com/linux/ubuntu bionic stable"
 sudo apt update
 apt-cache policy docker-ce
 sudo apt -y install docker-ce
 sudo systemctl status docker
Add into bashrc
alias drm="docker rm"
alias dps="docker ps -a"
alias dmi="docker images"
function da () {
    docker start $1 && docker attach $1
}
I have a running container, going through edits, changes, and i need to move this to a new server.
commit
First, commit (ref)
docker commit <containerid> myimages/lamp:v1.1You can see the list of images that you have with “docker images.”
Save to a file(ref)
sudo docker save -o <imagefile.tar> imageidTransfer the imagefile.tar to the new server.
Load them back (ref)
docker load -i <path to image tar file>
docker tag <Image-ID> myimages/lamp:v1.1
Run back.
http://multirbl.valli.org/lookup/
https://www.talosintelligence.com/
http://www.reputationauthority.org/
http://www.barracudacentral.org/lookups
https://mxtoolbox.com/blacklists.aspx
https://www.dnsbl.info/
https://www.blacklistmaster.com/