Web loading performance is important for visitor retention, and SEO. User will likely leave your website if it takes too long to load. You need to benchmark your website, to understand each components that being loaded to the user to improve user experience, and didnt keep them waiting.
The first step is to do benchmarking on your website, in terms of load time, with details of each component, such as
- Connection initiation (DNS, SSL negotiation, and connect)
- How much time it takes to respond with the data. (Time to First Byte – TTFB)
- How long does it take to get the data (transfer)
- Rendering (JS and CSS)
There are many tools out there for benchmarking your site performance.
- Google SiteSpeed
- Pingdom
- FastOrSlow (by Wordfence company)
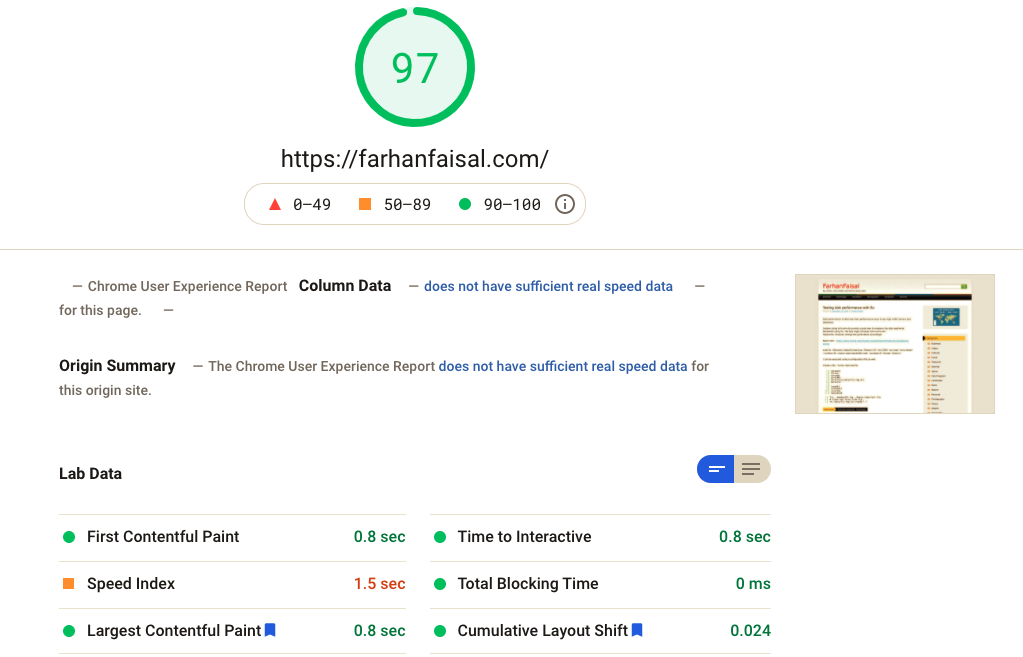
1. Google SiteSpeed
Google SiteSpeed is the most popular one, powered by Lighthouse, gives the detail analysis and suggestion for your website.
Its hierarchical map is quite different than any other service, where it give detail of each components loaded, in relation to the size. It can identify much of the those code are unused as well, if you’re looking into perfect reduction of code.
URL : https://developers.google.com/speed/pagespeed/insights/
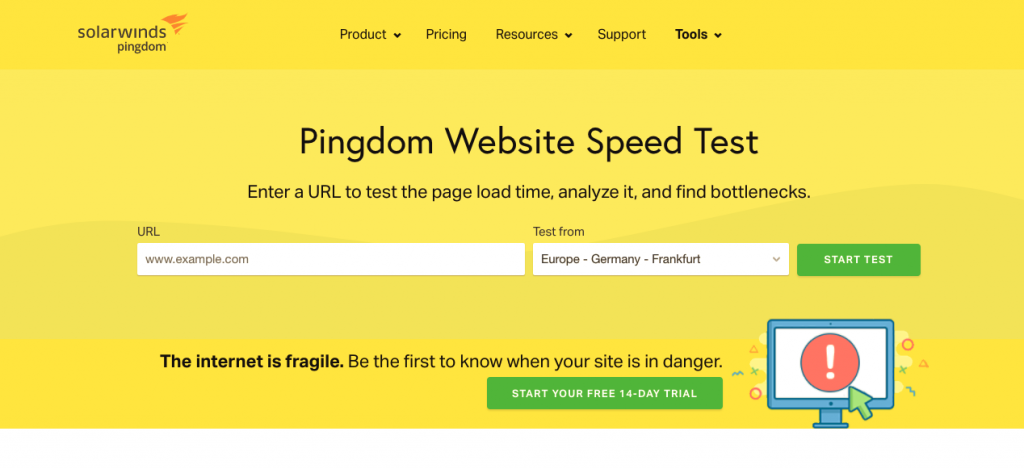
2. Pingdom
Pingdom have been in the operation for quite some time already. I can remember, when I was started developing websites, Pingdom is already there.
Pingdom have the options to choose the origin location of the test being made from. Its is important for you to understand if your CDN works, or how other region perceive your website in relation to your server location.
One other important feature in Pingdom is waterfall graph view, which visualize your web assets loading (images, css, js files) in comparison to each other in terms of timing. Its seems the feature is not available for free anymore.
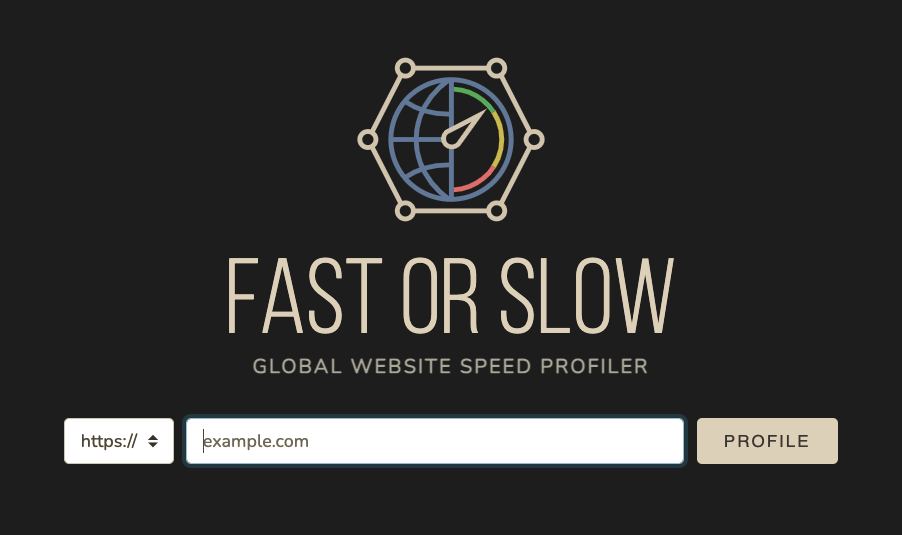
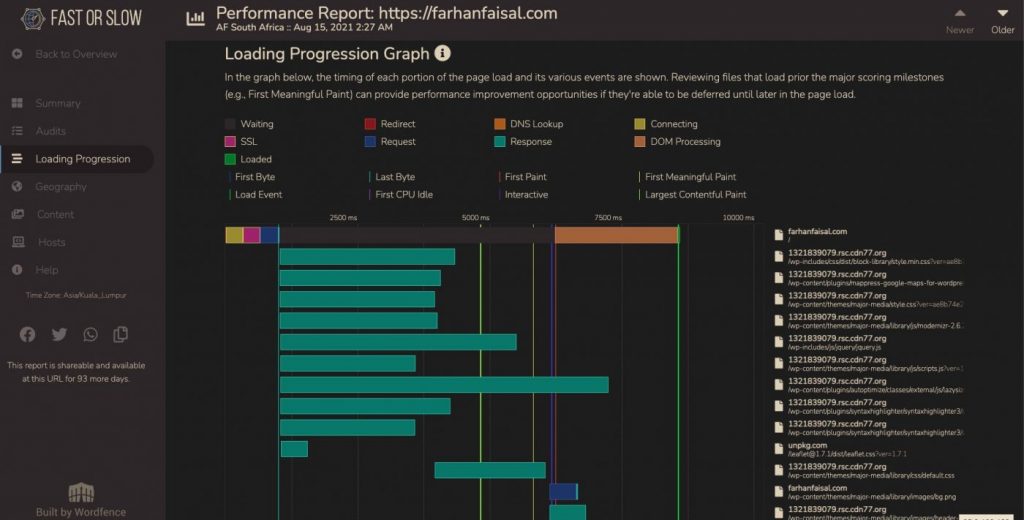
FastOrSlow
FastOrSlow is relatively new to the scene. Its free, and provided by Defiant, the company behind WordFence, the must have WordPress Security suite.
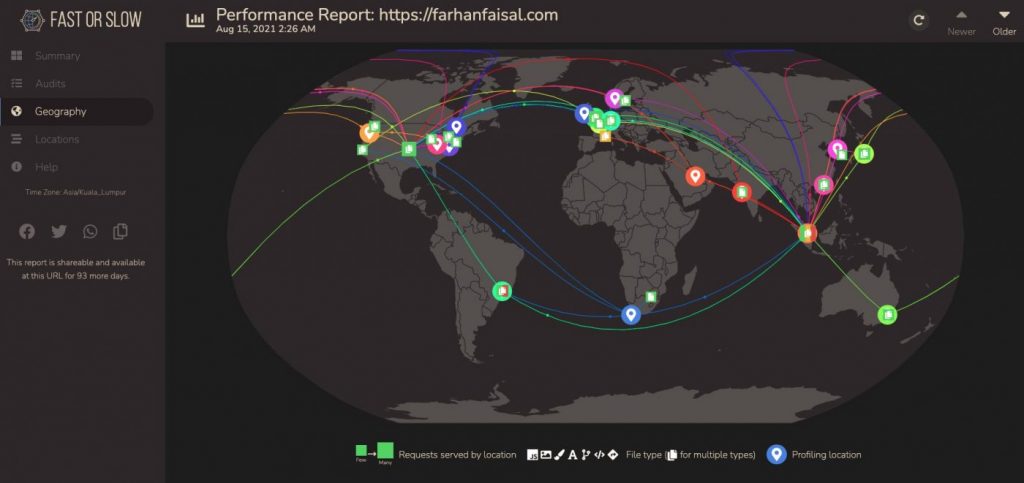
The coolest feature is that, you can perform the test from 18 locations globally all at once. And your score are given based on the data received from all location.
It gives a cool network map of data transfered to all locations from your server location/CDN, and also, the waterfall map. The waterfall map is one critical component you need, to understand your web performance on network level, and you can restrategize how the contents are loaded based on this data.
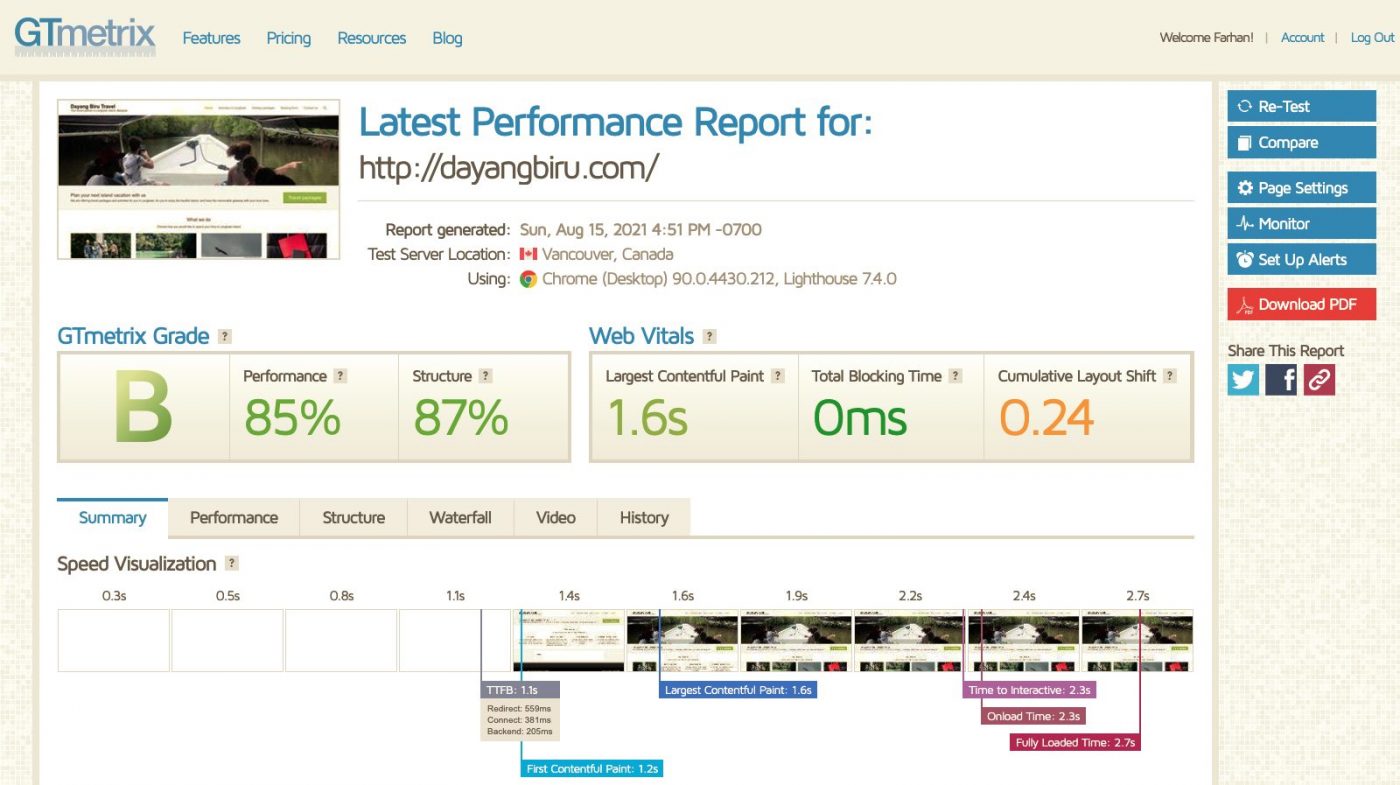
GTMetrix.com
GTmetrix is one of the simplest yet powerfull benchmarking tool. It also comes in an API, which you can do some integration with your monitoring tool. The FREE version comes 10 API credit, and 1 daily monitoring slot.
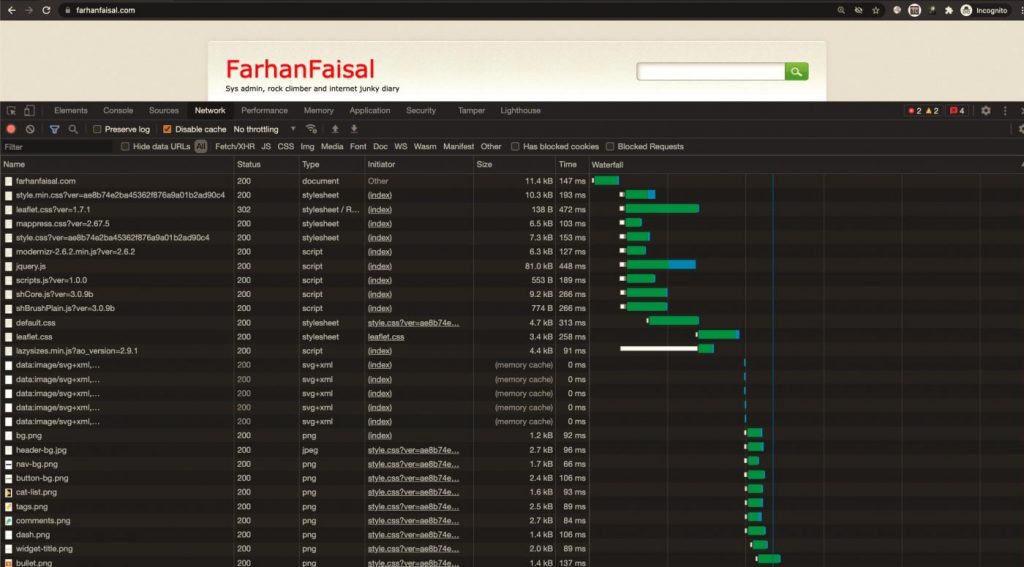
Browsers’s Developer Tool
The last and the basic tool where everyone have, your own browser. in Chrome, right click on your page, and go to Inspect, or through window tab View -> Developer -> Developer Tool.
This is just the first step, in optimizing your web performance, by understanding your own web. From these info you’re getting from these services, you should be able to
- Do you need CDN
- Do you need faster DNS provider (for authoritative, where you put your NS record)
- Is your web server is too slow (Cause by the web server itself, your code, or database)
- Your images are too big
- Your javascript or css are excessive.
- Your css/js need loading prioritization, to avoid render blocking. (for UX)
Hopefully I could spend some time to look into each of these aspects later.